Dear Clients:
The S&P 500 enjoyed a stellar first half of 2024, hitting 31 all-time highs. After posting a total return of 10.6% in the first quarter (11th highest since WWII, according to CFRA Research), the S&P 500 continued its upward trajectory in the second quarter with a total return of 4.3%. As a result, the S&P 500’s first half rise of 15.3% was the second strongest election year gain since 1944. Further, CFRA stated “history offers encouragement (but no guarantees) for gains to continue and for sequential improvements in the third quarter, fourth quarter and second half.”
In sum, as far as presidential election years go, “a market in motion tends to stay in motion.”
Not only has the S&P 500 had strong performance, volatility has been very low. It’s been well over a year since the S&P 500 has experienced a one-day decline of 2%. Knock on wood, in a few days we’ll eclipse the 350-trading day streak that ended in January 2018 (which was the longest since the 950-trading day streak that began in 2004).
You may recall 2021 was also a high-return/low-volatility “unicorn” that was followed by a brutal 2022. We don’t make predictions, but it would be wise to be mentally and psychologically prepared for a “typical” 10% correction, that could occur at any time for any or no reason. It’s all part of the journey.
You may have noticed we said the S&P 500 had a great first half of 2024, not “U.S. stocks.” As we’ll explain further, the reason is the capitalization-weighted S&P 500 massively outperformed the equally-weighted S&P 500, which we think is a much better representation of how the “average” stock performed. It’s against this backdrop we’re proud of the performance of client equity portfolios in the first half of 2024.
We devote all of our effort trying to generate long-term performance (dubbed “quiet compounding” by The Collaborative Fund’s Morgan Housel) for clients, so don’t pay much attention to short-term performance or outside recognition. That said, we were pleased to receive a “PSN Top Gun Award” for our “All-Cap Value” strategy for the 3-months and 1-year periods ending March 31, 2024. The PSN “All-Cap Value” universe is comprised of 73 firms and 93 products. The PSN universes were created using the information collected through the PSN investment manager questionnaire and use only gross-of-fee returns. Mutual fund and commingled fund products are not included in the universe. PSN Top Guns investment managers must claim that they are GIPS compliant.
What did “the market” do today?
We’ve all heard this question so often, we hardly think about what it means. Investors want an instant, simple, easy-to-digest, single-number statistic that encapsulates how U.S. stocks performed, today or over past periods. The usual answer is a quote of the points and/or percentage change for the Dow Jones Industrial Average (DJIA—a stock price-weighted index of only 30 stocks) or the Standard & Poor’s 500 (S&P 500—a capitalization-weighted index).
The problem with this simplistic approach is the question assumes “the market’ is a monolithic, homogeneous organism with constituent pieces that move in lock step. In reality, “the market” is comprised of idiosyncratic individual stocks. Trying to accurately capture and convey the price movements and performance of a market of stocks (vs. a stock market) is extraordinarily difficult, so we default to the simplistic DJIA or S&P 500. These usually give a good directional representation of whether the average stock was up or down. Less often they give a reasonable approximation of how the average stock performed.
However, there are times like now when the S&P 500 paints a wildly different picture of what’s happening in the market of stocks (where we actually operate on a daily basis).
The S&P 500 is a market capitalization-weighted index, which means the stocks with the highest market capitalizations have the highest weightings and biggest impacts on index performance. The 10 largest stocks in the S&P 500 (2% of the stocks) have a combined weighting of 38% (which means the remaining 490 (98% of the stocks) have a combined weighting of just 62%. As the name implies, each stock in the equal-weighted S&P 500 has the same 0.2% weight and impact on index performance.
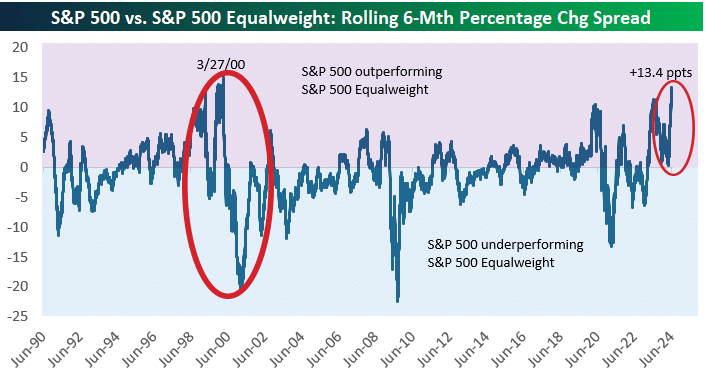
We think the performance of the equal-weighted S&P 500 gives a better representation of how the “average stock” performed. While the traditional, capitalization-weighted S&P 500 had a total return of 4.3% and 15.3% for the second quarter and first half, respectively, the equal-weighted S&P 500 had a total return of minus 2.6% and just 5.1%, for the same periods. This huge divergence actually expanded at the start of the third quarter. The graph from Bespoke Investment Group (“Bespoke”) below shows the performance gap between the S&P 500 and equal-weighted S&P 500 for rolling 6-month periods. The recent 13.4% gap was the highest since the peak of the dot-com bubble in late March 2000. Past performance is no guarantee of future results, but following the bursting of the dot-com bubble the equal-weighted S&P 500 massively outperformed the S&P 500.

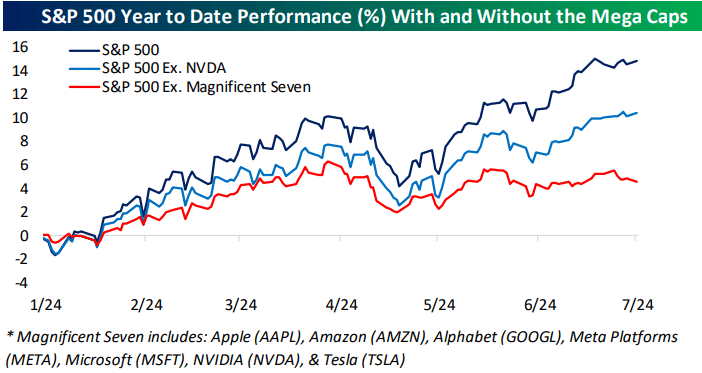
Drilling a little deeper, the strong performance of the “Magnificent Seven” stocks in the first half of 2024 (Apple (AAPL 19.2%), Amazon (AMZN 27.2%), Alphabet (GOOGL 30.4%), Meta Platforms (META 42.5%), Microsoft (MSFT 18.9%), NVIDIA (NVDA 149.5%) and Tesla (TSLA -20.4%) was the force powering the S&P 500. Clearly, it was a “tale of two markets.” According to Bespoke, while the S&P 500 had a total return of 15.3% for the first half of 2024, without the “Magnificent Seven” stocks the index would have only been up about 4%.

NVIDIA jumped two-and-a-half fold in the first half of 2024 on investor enthusiasm for all things related to artificial intelligence (AI). With a market capitalization of over $3 trillion, NVIDIA has the third largest weighting in the S&P 500 (6.6%) and alone accounted for about a quarter of the S&P 500’s gain. Clearly, if you didn’t have a significant position in NVDA (i.e. 6.6%) in your portfolio, keeping pace with the S&P 500 was an impossible challenge (for most!).
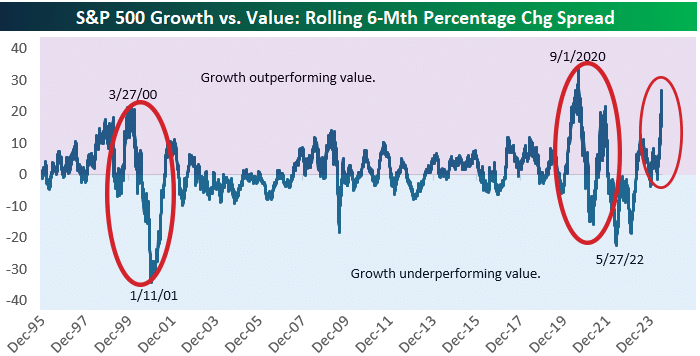
There was also a huge performance gap between “Growth” and “Value” in the first half of 2024, with the S&P 500 Growth Index posting total returns of 9.6% and 23.6% for the second quarter and first half, respectively versus minus 2.1% and just 5.7% for the S&P 500 Value Index. As shown in the illustration from Bespoke below, this gap has eclipsed the high reached at the peak of the dot-com bubble in late March 2000. The gap was even higher in September 2020 following the post-COVID lockdown rally. Again, past performance is no guarantee of future results, but following both the peak in early 2000 and late 2020, the gap saw a massive reversal in favor of “Value” within the next year.

In sum, we believe the S&P 500 gave a very poor representation of “the market” in the first half of 2024. In the real world “market of stocks,” we were swimming against a very strong tide, so are pleased we were able to keep pace.
Spotlight Stock: Vistra Corp. (NYSE: VST)
As “Value” investors, we tend to own stocks that aren’t popular or household names. Because of this, we thought clients might find it interesting if we highlighted a stock each quarter, explaining what the company does and why we like it.
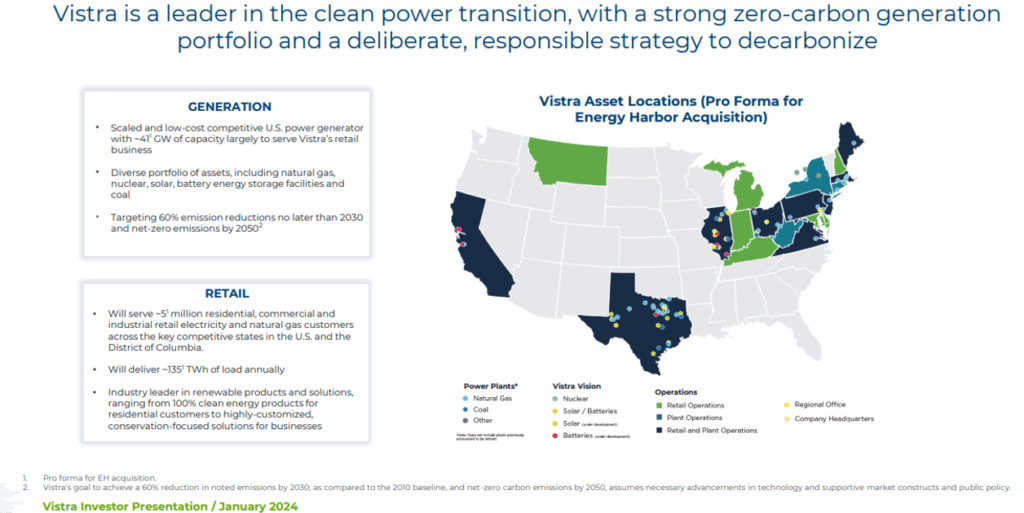
Vistra Corp. is one of the largest independent power producers and retail electricity providers in the country. In 2023, Vistra’s natural gas, nuclear and coal plants generated over 20% of electricity consumed in Texas. Vistra operates in deregulated markets where it sells electricity at whatever rate the market will bear. We think the company has done an excellent job with capital allocation. Management has closed unprofitable coal plants and managed the existing plants for cash flow. The company has also been aggressively buying back stock and making acquisitions. Vistra recently purchased Energy Harbor, another independent power operator with exposure to nuclear. We believe investors have finally come to the realization wind and solar are not consistently reliable. At the same time, demand for electricity is steadily increasing. We think data centers, electric vehicles and the unreliability of wind and solar have placed Vistra in the unique position of meeting this growing demand.

Regards,
Kirr, Marbach & Company, LLC
Past performance is not a guarantee of future results.
The S&P 500 Index is an unmanaged, capitalization-weighted index generally representative of the U.S. market for large capitalization stocks. This index cannot be invested in directly.
The S&P 500 Value and Growth Indices are sub-indices of the S&P 500 Index whose constituents are determined on the ratios of book value, earnings and sales to price. These indices cannot be invested in directly.
The equal-weight S&P 500 Index is an unmanaged, equally-weighted index generally representative of the U.S. market for large capitalization stocks. This index cannot be invested in directly.
The Dow Jones Industrial Average is an unmanaged, price-weighted index comprised of the common stocks of thirty major industrial companies. This index cannot be invested in directly.


