
The First Half of 2020 Was a “Spock” Market

Dear Clients:
We are pleased to report client equity portfolios experienced excellent performance in the quarter ending June 30, 2020, both on an absolute and relative basis. The S&P 500 had its best quarter since the fourth quarter of 1998, more than 20-years ago. We never focus on short-term results, but given the debacle in the first quarter of 2020 and the fact “Value” continued to lag “Growth” significantly in the second quarter (more on that later), we’re happy for any ray of sunshine.
Stock market volatility was epic during the first half of 2020, six months that shook the world. U.S. stocks hit a new all-time high “way back” on February 19, with the S&P 500 reaching 3,386. As the government effectively shut down the economy in an attempt to contain the pandemic, fears of a COVID-related apocalypse ignited. Panic selling ensued, with the S&P 500 plunging 34% to 2,237 over the next five weeks, marking the market’s fastest trip ever into bear territory and ending the 11-year bull run.
That low was reached on March 23rd, the day the Federal Reserve announced a major expansion of its effort to address the economic fallout and signaling it was prepared to utilize every monetary tool in its arsenal to the maximum extent. Four days later, the $2 trillion Coronavirus Aid, Relief and Economic Security (CARES) Act was enacted, demonstrating lawmakers’ resolve to bring an unlimited amount of fiscal firepower to the fight.
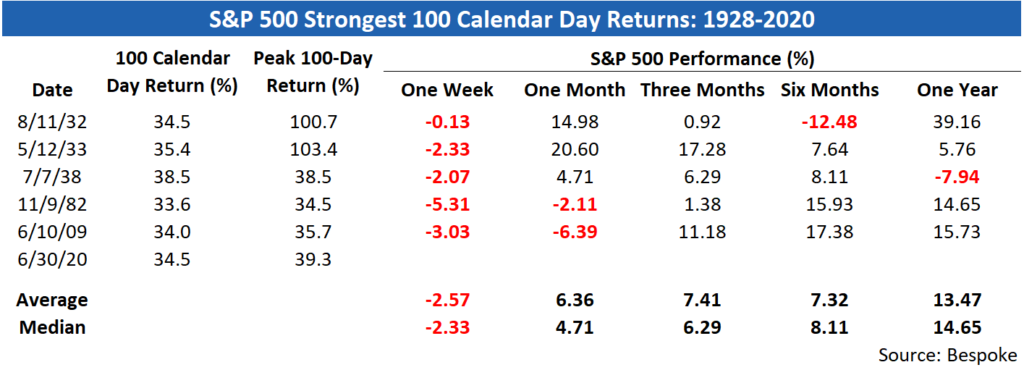
Investors were optimistic the Fed and Congress had learned the lessons from the Great Financial Crisis (GFC) a decade ago and were aggressively implementing many of the same policies that were developed “on the fly” back then. This “whatever it takes” mentality led panic selling to quickly morph into fear of missing out (FOMO), as the S&P 500 surged 17.6% from March 24-26, the biggest three-day advance in more than 80 years. Stocks continued higher, with the S&P 500 posting its best 100-day rally in more than 80 years. Indeed, until 2020 the S&P 500 had not had a down 20% quarter followed by an up 20% quarter since 1932 (Q2/Q3), the depth of the Great Depression.
As always, past performance doesn’t guarantee future results. In addition, as shown in the table from Bespoke Investment Group, there were only five prior 100-day periods when the S&P 500 rallied by more than one-third, so the sample size is small. Still, the returns were generally pretty strong one-year out.
On June 8, the National Bureau of Economic Research, the official arbiter of the start and end of recessions, declared the severity and breadth of the pandemic-induced plunge in economic activity had forced the U.S. economy into a recession in February, marking the end of the 128-month expansion that started in June 2009, the longest in records going back to 1854.
How can you explain the stock market’s wild mood swings from the depths of despair to soaring optimism (both in the face of a dismal economic environment)? Financial columnist Barry Ritholtz suggests if you think of the “Spock market” instead of the stock market, the “raging disconnect between the economy and equity prices becomes easier to grasp.”
For non-Trekkies, Mr. Spock was science officer and second-in-command aboard the starship USS Enterprise in the “Star Trek” media franchise. Spock’s mother (Amanda Grayson) was human and his father (Sarek) was Vulcan, a race known for “hyper-rationalism.” Spock’s human side was emotional and irrational and his Vulcan, logical side often struggled to keep it under control.
Much of the time investors are rational and the stock market is understandable and makes intuitive sense, says Ritholtz. When the economy is expanding and profits are growing, prices rise. If the economy tanks, prices plunge. However, there are other times investors are clearly irrational. When fear or greed take hold of the steering wheel, anything can happen. Ritholtz says this is apparent at major turning points in the market, such as the top of the dot-com bubble in March 2000 and the bottom of the GFC in March 2009.
Most recently, this was apparent in the wild, totally illogical trading in the worthless stocks of bankrupt companies (like Hertz) as bored folks with stimulus money to burn flocked to the only open “casino” in town. This was not surprising in this brave new world of “commission-free” trades and stock trading apps like Robinhood (which opened mind-blowing 3 million new accounts in the first quarter) whose user interface makes “investing” seem as easy and addictive as playing a video game.
What could go wrong?
Ritholtz said “Spock’s mixed human-Vulcan heritage was a great plot device that allowed ‘Star Trek’ to subtly comment on the human condition, exploring the tension between logic and emotion, between our intellectual capabilities and baser drives. Investors who recognize and take account of the Spock market will better understand what’s going on, and –one can hope—use it to guide their actions for better results.”
Was the market’s surge from the March 23 low was an illogical disconnect from a reeling economy or a logical look past the valley to a better post-COVID world? On the fundamentals side, we believe the Fed’s pledge on June 10 there would be no rate increases through 2021 (and possibly 2022) should provide significant support for higher earnings multiples and stock prices. In addition, lower yields on bonds means they offer less competition to stocks. That said, it also seems likely the market’s path will continue to be highly impacted by the ebb and flow in the war on COVID. Soothsayers claim to see the future, but nobody knows, no matter how confident they sound.
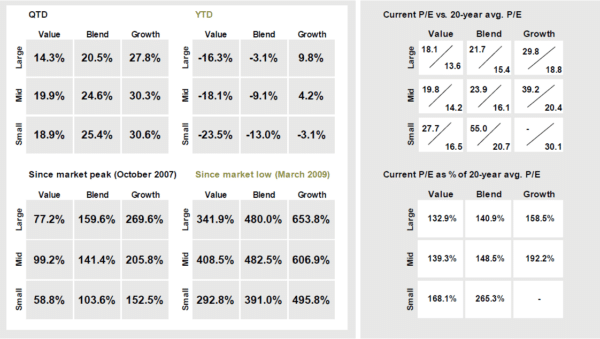
You’re probably more tired of hearing about it than we are writing about it, but the relative outperformance of “Growth” vs. “Value” is even greater than it was during the technology/dot-com bubble that burst in spectacular fashion in 2000. There have been several recent periods when “Value” outperformed, all of which proved to be short-lived.
As you can see in the illustration below from J.P. Morgan Asset Management, “Value” continued to lag significantly behind “Growth” in the second quarter of 2020.
As we alluded to in our Q1-2020 letter, we used the market downdraft as an opportunity to upgrade the quality of client equity portfolios (i.e. buying high-quality stocks of better businesses we previously viewed as too expensive). Our only regret is stock prices didn’t stay down long enough for us to take full advantage, as the move up was as violent as the move down.
While we remain steadfast and loyal to our “Value” strategy, we think it makes good sense to broaden our definition of “Value,” a term that has become to mean strictly “low-multiple,” whether that refers to price-to-earnings, enterprise value –to-EBITDA, cash flow or other metrics. Whereas these valuation metrics can be useful in screening the universe of stocks for possible investment candidates, you have to assess a company’s products, competitive position, growth prospects, quality of management and many other factors before you can judge whether a cheap stock is a “cigar butt” or undervalued opportunity.
Warren Buffett made a similar pivot. In this 1989 letter to Berkshire Hathaway shareholders, he said: “If you buy a stock at a sufficiently low price, there will usually be some hiccup in the fortunes of the business that gives you a chance to unload at a decent profit, even though the long-term performance of the business may be terrible. I call this the ‘cigar butt’ approach to investing. A cigar butt found on the street that has only one puff left in it may not offer much of a smoke, but the ‘bargain purchase’ will make that puff all profit.”
Berkshire’s Vice-Chairman, Charlie Munger, convinced Buffett investing in discarded cigar butts was not going to cut it as Berkshire reached gargantuan size, so they should look for investment value in great businesses that whose operations and/or stock price were temporarily under pressure. Indeed, Berkshire owns 5.7% of Apple Inc., which is by far its largest common stock investment (more than twice as big as #2).
We’ll always be “Value” investors, but will focus on finding undervalued stocks of better businesses and leave the “cigar butts” lying in the street.
KM’s Advice to Stay Calm, Stay In and Stay the Course
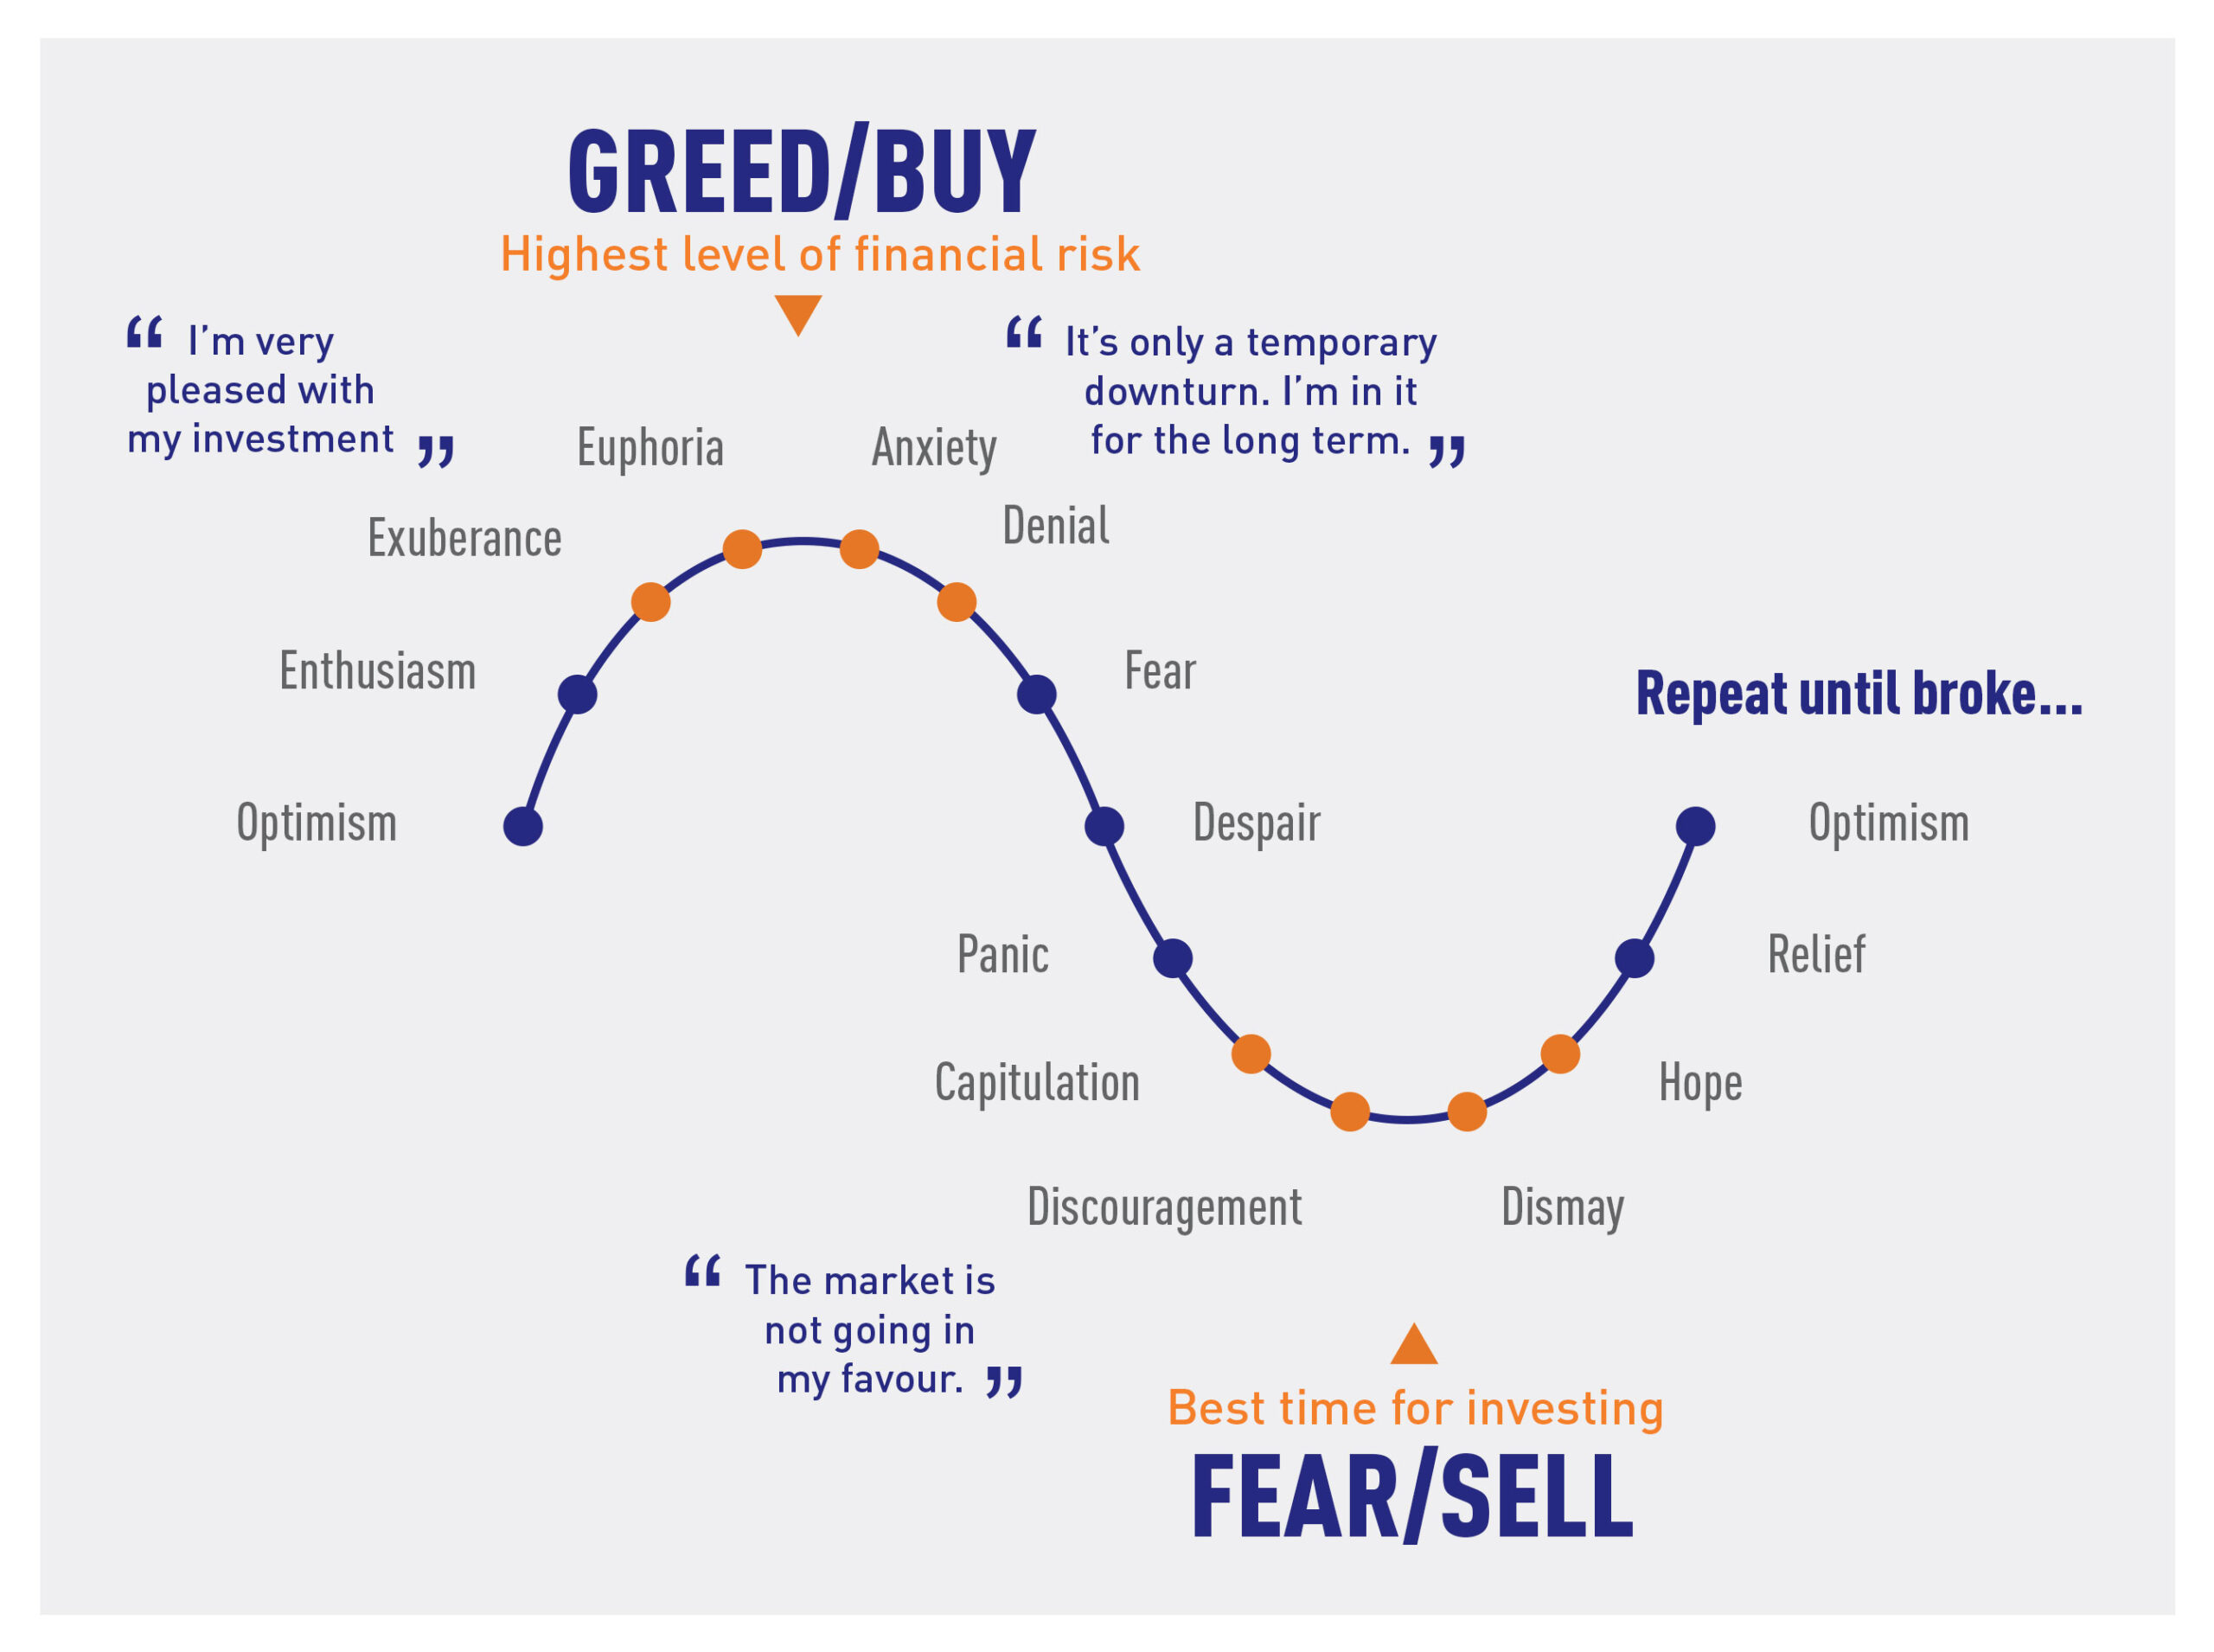
If there’s a singular lesson from the first half of 2020, it’s that since developments can unfold at warp speed, you have to maintain discipline to keep from getting whipsawed. We used the illustration below in our Q1-2020 letter. The curve generally takes many months or even years to unfold, but as 2020 has shown, sentiment can also morph in a matter of days.
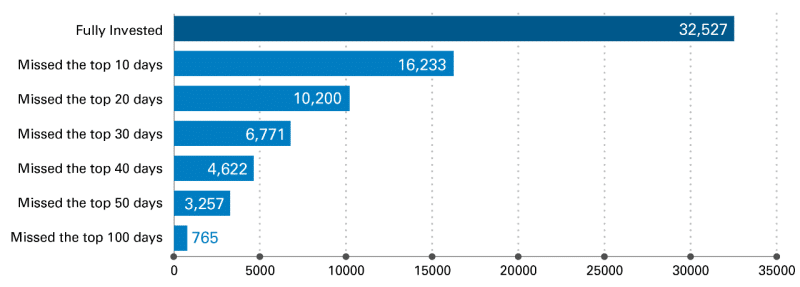
Missing even a few good days can make a huge difference in returns. For instance, if you had invested $10,000 in the S&P 500 at the closing low on March 23, 2020, you would have had $13,910 on June 30, 2020. However, if you waited just three days (until the close on March 26), you would have had only $11,849. Looking at a longer-term example, Legg Mason calculated if you invested $10,000 in the S&P 500 at the beginning of 2000 and left it untouched for 20-years (a period that included the Great Financial Crisis, Brexit, the Greek debt default and a hundred other reasons to get out of the stock market), you would have ended up with $32,527. However, if you had missed just the 10 best days in those 20-years, you would have ended up with only half that amount.
Market timing is a fool’s errand. Stay calm, stay in and stay the course.
Summary
We’re happy the U.S. stock market has staged a strong recovery from the depths of despair in late March. We recognize we still have much ground to make up, but are confident our broadening of our approach to “Value” investing will continue to bear fruit. Finally, we should all realize with the upcoming election and ongoing battle with the pandemic, the second half of 2020 will likely be a harrowing ride.
We thank you for the trust and confidence you’ve placed in us as we try to navigate these stormy seas.
Regulatory Update
Registered investment advisers like Kirr, Marbach were required to file ADV-Part 3/Form CRS (Client Relationship Summary) with the SEC by June 30, 2020 and deliver it to clients within 30 days of filing. Form CRS describes the adviser’s services and fees. It is limited to 2-pages and has certain required notifications, topics and “conversation starters.”
You can find a copy of KM’s Form CRS here.
2020 RMD 60-Day Rollover Extension
The IRS recently announced rollover relief for required minimum distributions (RMDs) from retirement accounts, under the CARES Act waiver.
Due to the CARES Act, clients who were subject to taking an RMD in 2020 are relieved of having to take one this year. As announced previously, individuals who had already taken their RMD in 2020 may be eligible to roll over the funds back into their retirement account, with a rollover extension date of July 15.
A recent announcement by the IRS has extended the 60-day rollover period for any RMDs that were already taken in 2020 to August 31, 2020. For more information, review the announcement published on irs.gov.
Regards,
Kirr, Marbach & Company, LLC
Past performance is not a guarantee of future results.
The S&P 500 Index is an unmanaged, capitalization-weighted index generally representative of the U.S. market for large capitalization stocks. This index cannot be invested in directly.
Subscribe
Subscribe to stay up to date with the latest news, articles and newsletters from Kirr Marbach.


