
Dear Clients:
Though we never focus on short-term performance, we are nonetheless pleased client equity portfolios had solid performance in the second quarter of 2021, building on the stellar gains from the fourth quarter of 2020 and first quarter of 2021. We’re invested alongside you and are quite satisfied with where we stand at the mid-point of 2021.
This is not to imply we’re resting easy. On the contrary, we remain vigilant to the extreme. As we’ll discuss further, recent readings on inflation have ignited fears of a return to the stubbornly high inflation of the 1970s-early 1980s that plagued our economy. We don’t see it at this point, but if the facts change, our opinion will change.
The S&P 500 Index closed the second quarter of 2021 at a record high, as Strategas reported 88% of the companies in the index beat Q1-2021 earnings estimates (a record high going back to the mid-1990s and well above the long-term historical average of 65%). According to CFRA, the S&P 500’s gain in the first half of 2021 was the 13th strongest in the past 76 years. For the Top 20 first-half performances since WWII, the S&P 500 rose an average 8.0% in the second half (H2), compared with the average H2 return of 4.5% for all years. What’s more, the frequency of advance (FoA) jumped to 80% for the Top 20 vs. 69% for all years. However, CFRA also noted the S&P 500 had gone 280 days since the previous decline of 5% or more, which was a pre-election pullback of 9.6% from 9/2/20 through 9/23/20. The average timespan time span between pullbacks of >5% has been 178 days, which makes the current advance the 18th longest since World War II. Statistically, the U.S. stock market is long overdue for a >5% decline.
The Post-COVID Comeback for Value Paused in Q2-2021
Recall “Value” underperformed “Growth” by the biggest margin on record for the full year 2020, but staged an impressive comeback in the final quarter of 2020 and first quarter of 2021, as the “growth scarcity” premium that powered the mega-capitalization technology darlings abated as progress on the COVID vaccine front brought visibility to the reopening/recovery of the economy. This led to the strongest rotation from “Growth” into “Value” in a decade.
While we thought and still think this rotation into “Value” has “legs” and is well-supported by the fundamentals, we never expected the rotation to continue unabated, quarter after quarter. Indeed, after the Fed announced in mid-June the strength of the post-COVID economic recovery would enable it to move its timetable for removing emergency stimulus measures enacted during the COVID-induced economic collapse forward, “Value” stumbled as investors believed the Fed risked choking-off the economic recovery and, concomitantly, earnings gains for more cyclical, economically-sensitive stocks.
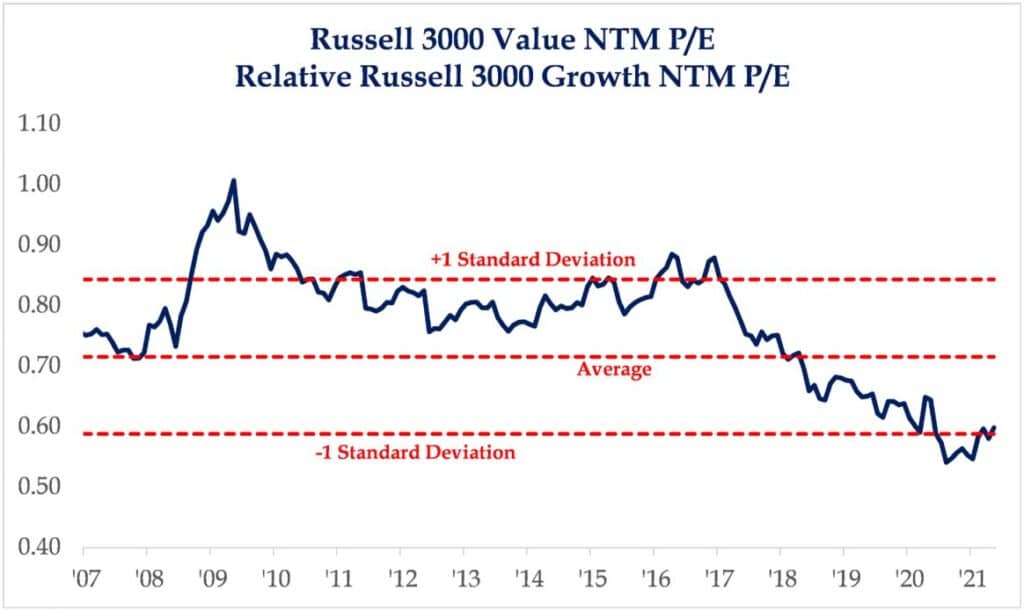
From a relative valuation point of view, “Value” remains very cheap relative to “Growth.” As shown in the graph below from Strategas, the “strongest-in-a-decade” rotation into “Value” that began in the last quarter of 2020 registers as a tiny blip in relative valuation.
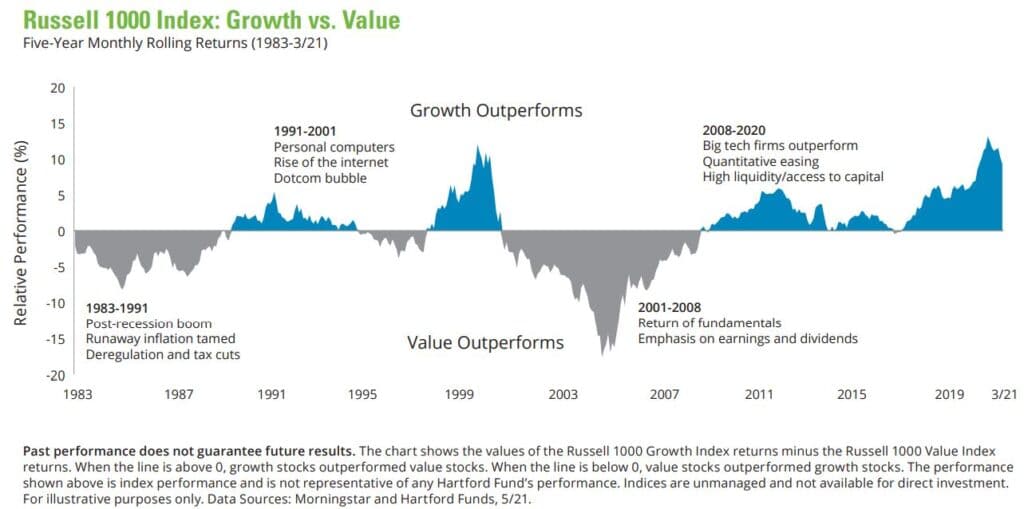
In addition, while past performance does not guarantee future results, “Value” and “Growth” styles have historically tended to experience up and down cycles lasting for years, not months. The illustration from Hartford Funds below shows while the most recent period of “Value” relative underperformance was painfully long in time and deep in magnitude, it was consistent with the cyclical nature and ebb and flow of “Value” vs. “Growth” investing.
Investors should stay cool while inflation fears run hot
The front-page banner headline of the June 11 edition of The Wall Street Journal screamed “Inflation Jumps to 13-Year High,” as the Consumer Price Index (CPI—measures prices for a weighted basket of consumer goods and services) for May increased by 5% over May of 2020. The stronger-than-expected recovery from the COVID-induced shutdown of the U.S. economy coupled with higher-than-expected indications of inflation have sparked a debate about whether the U.S. is entering an inflationary period similar to the 1970s.
It seems like eons ago, but it was just March of 2020 when the Federal Reserve reduced its target for short-term interest rates to near zero and announced a program to purchase $120 billion/month of Treasury and mortgage bonds to hold down long-term borrowing costs, part of the government’s multi-pronged/multi-trillion-dollar plan to rescue the economy from the sharpest contraction in generations.
Fast forward to today and the success of the vaccination program has led to a rapid reopening of the economy, which has unleashed a torrent of pent-up demand. The nearly total shutdown of an economy and subsequent reopening is a truly unique event without precedent or playbook.
Regarding the recent elevated inflationary readings, both Treasury Secretary Janet Yellen and Fed Chairman Jerome Powell acknowledge inflation is higher than expected a couple months ago, when the economy had not yet fully reopened. Further, while this condition will likely persist for several more months, they view the surge in inflation as “transitory” in nature, due to a combination of pent-up demand and “bottlenecks” in the supply chain that had developed during the pandemic.
In other words, while inflation is likely to run higher than the Fed’s target of 2% for a while, supply and demand will eventually regain balance and inflation will moderate.
Pessimists see today’s elevated inflation as a precursor to the return of persistent double-digit inflation that plagued the U.S. economy four decades ago that led to 30-year mortgage rates of 16% and President Gerald Ford’s ill-conceived 1974 “Whip Inflation Now (WIN)” voluntary anti-inflationary plea that resulted in buttons and bumper stickers, but nothing of substance.
Various experts, pundits and soothsayers profess to know how this will all unfold, at high volume and with great confidence. The truth is nobody knows, so we believe more humility and light and less heat will be helpful.
A little inflation is way better than deflation, which occurs when there is too little demand and too much supply, leading to lowered production and employment, a downward spiral in prices, debt defaults and recession/depression. In fact, Secretary Yellen welcomed the uptick in inflation, saying, “we’ve been fighting inflation and interest rates that are too low now for a decade.”
The “base effect” refers to the fact economic activity and prices collapsed during the depths of the shutdown, which has caused recent annual increases in the CPI to be artificially high. This mathematical distortion in annual CPI inflation started in March 2021, peaked in May and will continue through August. It’s more accurate to calculate the change in CPI versus the same month two-years ago (instead of last year) and annualize the difference. On that basis, the May increase would have been 2.5%, not far from the Fed’s 2% target and 50% less than the headline-grabbing 5%.
Additionally, CPI inflation has been heavily impacted by price increases for certain specific categories that were crushed last spring and/or are unlikely to persist. For instance, the shortage of semiconductor chips has restricted production of new vehicles, causing a spike in used vehicle prices, which were up 29.7% in May vs. 2020 and up 13.7% vs. 2019. Indeed, used vehicles alone accounted for fully one-third of the CPI increase in May.
Bond investors are “inflation vigilantes,” but don’t believe the scary headlines. The yield on the 10-year US Treasury Bond has actually dropped from 1.7% at the beginning of April to just under 1.5%. Similarly, the “breakeven” or implied inflation expectation on the 10-year US Treasury Inflation-Protected Bond (TIPS) is about 2.3%, unchanged since the start of the quarter.
The stock and bond markets shuddered briefly when the Fed announced on June 15 it was leaving its target for short-term interest rates near zero and maintaining its bond purchases, but now anticipated the strength of the recovery will enable them to begin moving the “patient” out of the ICU sooner than they expected a couple months ago. To us, that’s unambiguously good news.
Despite the slightly “hawkish” (i.e., higher interest rates) stance from the Fed, we still think Chairman Powell will be very cautious about possibly removing stimulus too soon and choking off the recovery. Personal experience impacts us all and Mr. Powell had a hand in three prior Fed policy changes that, in hindsight, proved to be wrong. In 2013, he pushed for a “tapering” of the pace of the bond-buying in the Fed’s quantitative easing program, which set off a “taper tantrum” from the financial markets and led them to reverse course. In 2015, he supported the decision to begin raising short-term interest rates, which led to a premature slowing of the economy. In 2018, under his leadership as Chairman, the Fed embarked upon a series of four interest rate hikes, the last of which sent the markets into a tizzy and caused Mr. Powell to backtrack within days.
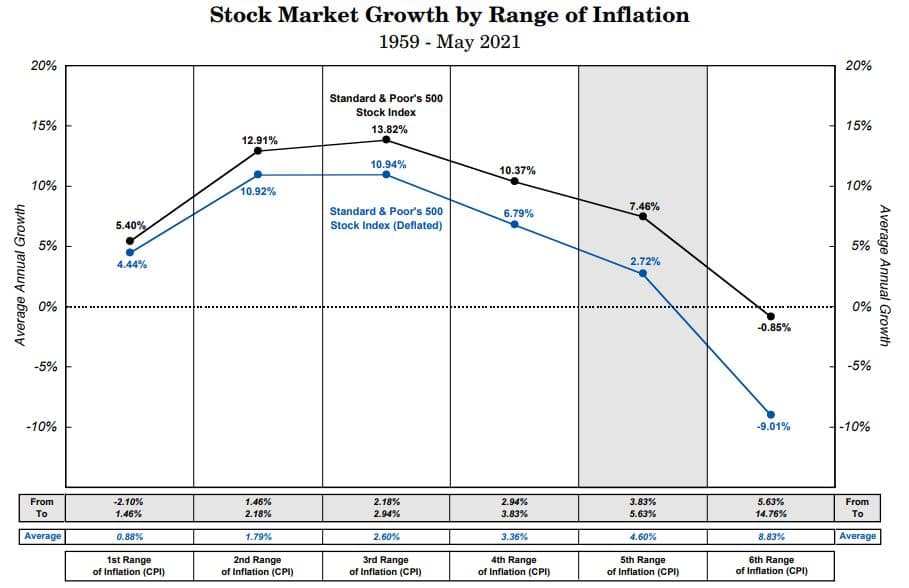
Even if inflation rises above the Fed’s long-term 2% target, history suggests fears of a significant sell-off of stocks may be overblown. The illustration below from Crandall, Pierce & Company shows how the S&P 500 performed during various ranges of CPI inflation since 1959. There is no guarantee the pattern will repeat itself going forward, but according to the data, U.S. stocks have done reasonably well until CPI inflation reaches about 4.5-5% (i.e., about twice the Fed’s long-term target).
We’re in the “transitory” inflation camp until the data dictates otherwise, but expect continued volatility as investors remain on edge and central banks worldwide grapple with their own “pandexit” strategies.
Confusing Speculating With Investing IS Hazardous to Your Wealth
There’s a whole industry built around convincing you investing is as easy as child’s play and you can trade your way to prosperity, all for free. Whether it’s the very clever and entertaining “Don’t Get Mad, Get E*Trade” ads featuring dogs or talking babies, TD Ameritrade offering you an in-depth, 30-second “Strategy Gut CheckSM” before you click “BUY” on your phone app or Robinhood’s self-righteous “We Are All Investors” commercials, it’s the same seductive siren song that everyone is getting rich but you. Fidelity wants to lure an even younger demographic, recently launching a “youth account” product for those ages 13 to 17.
There is a big difference between trading/speculating and investing. Speculators may or may not know anything about an asset, but buy it on a hunch or because a celebrity is promoting it or everybody else is buying it and it’s going up without me (“FOMO”). They crave the thrill of the “home run” by purchasing assets like Bitcoin that will never produce anything in the hope the pool of like-minded speculators, who also know Bitcoin will never produce anything, will expand and enable them to sell it at a higher price.
By contrast, investors are content to stay within their “Circle of Competence” and buy productive assets with a sound fundamental case for a reasonable rate of return. They play the boring “long game,” trying to hit singles and doubles and letting the “miracle of compound interest” put runs on the scoreboard.
We have no quarrel with speculating and understand the periodic need for some folks to scratch that itch, as long as it’s recognized as such and confined to a relatively small “play money” account. Similarly, we occasionally venture to a casino, where we understand we’re likely to lose when we gamble and the “free” cocktails aren’t really free. The casino is there to entertain and doesn’t masquerade as a place where you risk serious capital on investments.
Charlie Munger, Warren Buffett’s 97-year-old longtime business partner and Vice-Chairman of Berkshire Hathaway recently weighed-in on the online brokers offering “free” trades. “I hate this luring of people into engaging in speculative orgies,” he said. Further, “Robinhood may call it investing, but that’s all bullshit (his word) …It’s really just wild speculation, like casino gambling or racetrack betting. There’s a long history of destructive capitalism, these trading orgies whooped up by the people who profit from them…Nobody should believe Robinhood trades are free. The frenzy is fed by people who are getting commissions and other revenues out of this new bunch of gamblers.”
While it is true Robinhood doesn’t charge commissions on trades, it makes its money by routing customer trades to market makers like Citadel Securities and Virtu Financial for execution, a legal but controversial practice called “payment for order flow” (PFOF). The more “free” customer trades Robinhood routes, the more the market makers pay to Robinhood. Indeed, during 2020 the four largest “commission-free” brokers (TD Ameritrade, Robinhood, E*TRADE and Charles Schwab) raked-in a combined $2.5 billion in PFOF, more than doubling 2019’s take. Robinhood itself received almost $700 million in PFOF in 2020.
In fact, last December Robinhood agreed to pay $65 million to the SEC to settle charges it had misled customers by making false and misleading statements about 1) how it makes its money (i.e., from PFOF) and 2) how this practice led to customers receiving inferior trade prices, which deprived them of $34.1 million, even after taking into account the “savings” from not paying a commission.
That same month Massachusetts securities regulators filed a complaint accusing Robinhood of using “aggressive tactics to attract inexperienced investors” and “gamification strategies to manipulate customers.”
In response to Munger’s comments, a Robinhood spokesperson protested, “In one fell swoop an entire new generation of investors has been criticized and this commentary overlooks the cultural shift that is taking place in our nation today. Robinhood was created to allow people who don’t have access to generational wealth or the resources that come with it to begin investing in the U.S. stock market. To suggest that new investors have a ‘mindset of racetrack bettors’ is disappointing and elitist.”
Munger said, “I think you should try and make your money in the world by selling people things that are good for them. And if you’re selling them gambling services where you make profits off the top, like many of these new brokers who specialize in luring the amateurs in, I think it’s a dirty way to make money. And I think we’re crazy to allow it.”
Indeed, Just yesterday Robinhood agreed to pay nearly $70 million to settle sweeping regulatory allegations that it had misled customers, approved ineligible traders for risky strategies and didn’t supervise technology that failed and locked millions of its customers out of trading. Apparently, you get what you pay for.
You have to trade to invest, but just because you’re trading doesn’t mean you’re investing.
Mary and Larry Illustrate Compound Interest and the ‘Rule of 72’
As the quote from Albert Einstein at the top of the letter alludes, compound interest is a powerful lever that can make your financial life better. Or it can kill you.
How does compounding work? For simplicity, let’s assume you start with $100 and earn 8% on your investment, compounded annually. After Year One, you have $108 ($100 original investment plus 8% earned on it). After Year Two, you have $117 (the $108 you had at the start of the year plus 8% earned on it). After Year 3, you have $126 (the $117 you had at start of the year plus 8% earned on it), and so on.
Left undisturbed, your original $100 investment will have grown to $200 after Year Nine. This happens because each year you earn interest on your original investment and on all of the accumulated interest earned (i.e., interest on interest).
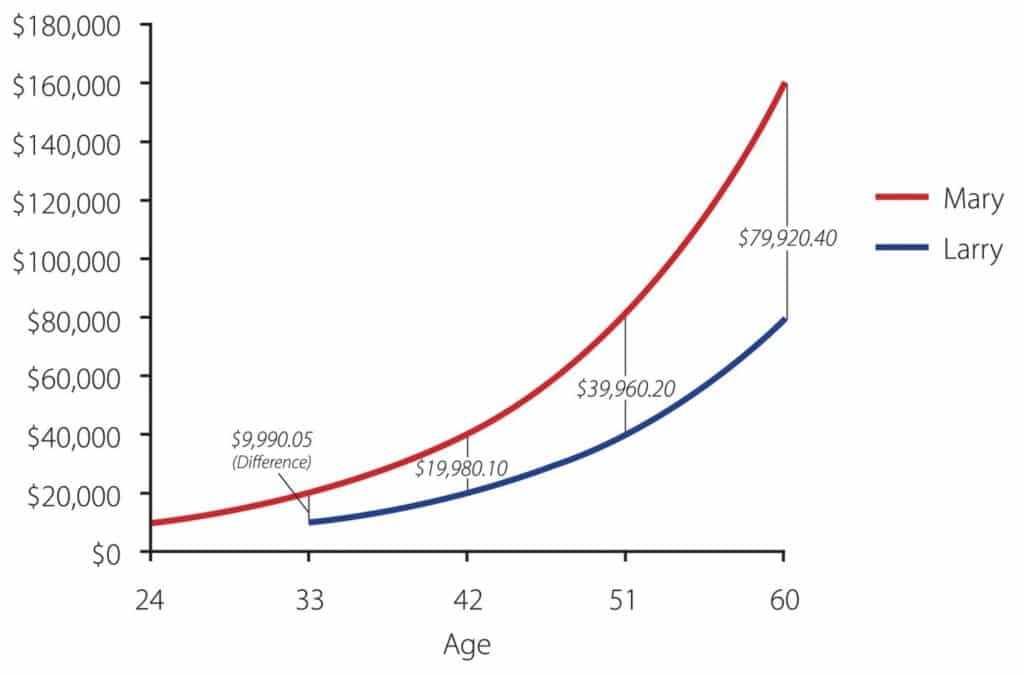
Meet Mary and Larry. The same age, they both invested $10,000 and earned the same 8%, compounded annually. The only difference (and it’s a big one) is Mary invested when she was 24, but Larry didn’t get around to it until he was 33. Perhaps Larry spent those nine years chasing meme stocks or cryptocurrencies? By the time they are 42, Mary has $40,000, but Larry only has $20,000. Looking out to 51, Mary has $80,000 and Larry $40,000. By the time they are 60, Mary has $160,000 and Larry $80,000.
The gap between Mary and Larry widened from $20,000 at 42 to $40,000 at 51 to $80,000 at 60, just from compounding. In other words, even though they invested exactly the same amount and earned the same return, Mary’s account had the huge benefit of compounding for 9 years more than Larry’s. Graphically, the farther out you go, the steeper Mary’s line gets compared with Larry’s, not just because she earned 9 more years of interest, but also because that accumulated interest itself earned more interest.
Enter the Rule of 72, which investors love. Simply divide 72 by your assumed interest rate/rate of return to get the number of years it takes to double your investment. At 6%, it takes 12 years. At 8%, it takes 9 years (you can ask Mary and Larry!). Whatever your return assumption, it’s better to start sooner rather than later. You want to let compounding work as long as possible for you.
The corollary is credit card companies love the Rule of 72 even more than investors.
Why’s that? The interest rates the credit card companies charge dwarfs the returns investors/savers can earn. Instead of 6-8% returns, you’re probably talking about at least 18% interest on outstanding balances. Disregarding the minimum monthly payment and assuming no further purchases, at 18% your credit card debt will double every four years (72 divided by 18). You can see how credit card debt can get out of control in a hurry.
Compound interest and the Rule of 72 can be tremendous financial levers to help you accumulate assets. Unfortunately, they can also crush you. Save/invest sooner and more and avoid credit card debt like the plague.
Your Behavior Key to Long-Term Investment Success
The concept of successful investing is easy. Invest in high-quality companies selling at reasonable valuations and let the “Miracle of Compound Interest” work its magic. Implementing that simple concept in real life is much more difficult. We are constantly bombarded with headlines that are mostly scary, whether related to runaway inflation, global pandemics or a thousand other things, real and imaginary. It’s hard to stay the course when the Chicken Littles are screaming “the sky is falling” at the top of their lungs.
\We’ve included a copy of an excellent piece from Nationwide (“Stay Focused When News Breaks”) about the consequences of emotional investor behavior we think you might want to keep handy. They examined the period 2000-2020 and found:
- The average investor trailed every financial asset class, because of headline-driven emotional investing and
- If you invested $10,000 in the S&P 500 Index at the beginning of 2000 and forgot about it or otherwise left it untouched, you would have had $25,832 by the end of 2020.
- However, if you had missed just the 20 best days over those 20 years, you would have actually lost money, ending with $8,056.
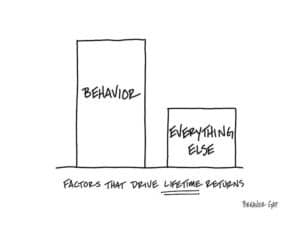
We’ve followed and admired the work of Carl Richards of behaviorgap.com because he has the uncanny ability to illustrate important investment concepts with a Sharpie and a cocktail napkin. Growth vs. Value is important. Stocks vs. Bonds is important. But they pale in comparison to if you had been scared out of the market at the bottom on March 23 (after the S&P 500 Index had plunged a harrowing 34% in just 23 trading days, it’s most rapid meltdown in history) and missed both the biggest daily percentage gain since 1933 (9.4% on March 24) and largest three-day advance in more than 80 years (17.6% from March 24-26). If you’re out of the market, you simply cannot make up those missed opportunities!
Regards,
Kirr, Marbach & Company, LLC
Past performance is not a guarantee of future results.
The S&P 500 Index is an unmanaged, capitalization-weighted index generally representative of the U.S. market for large capitalization stocks. This index cannot be invested in directly.
Subscribe
Subscribe to stay up to date with the latest news, articles and newsletters from Kirr Marbach.


